Destinations
The Destinations page shows you a table of existing materializations to which you have access. You can also create a new materialization with the New Materialization button.
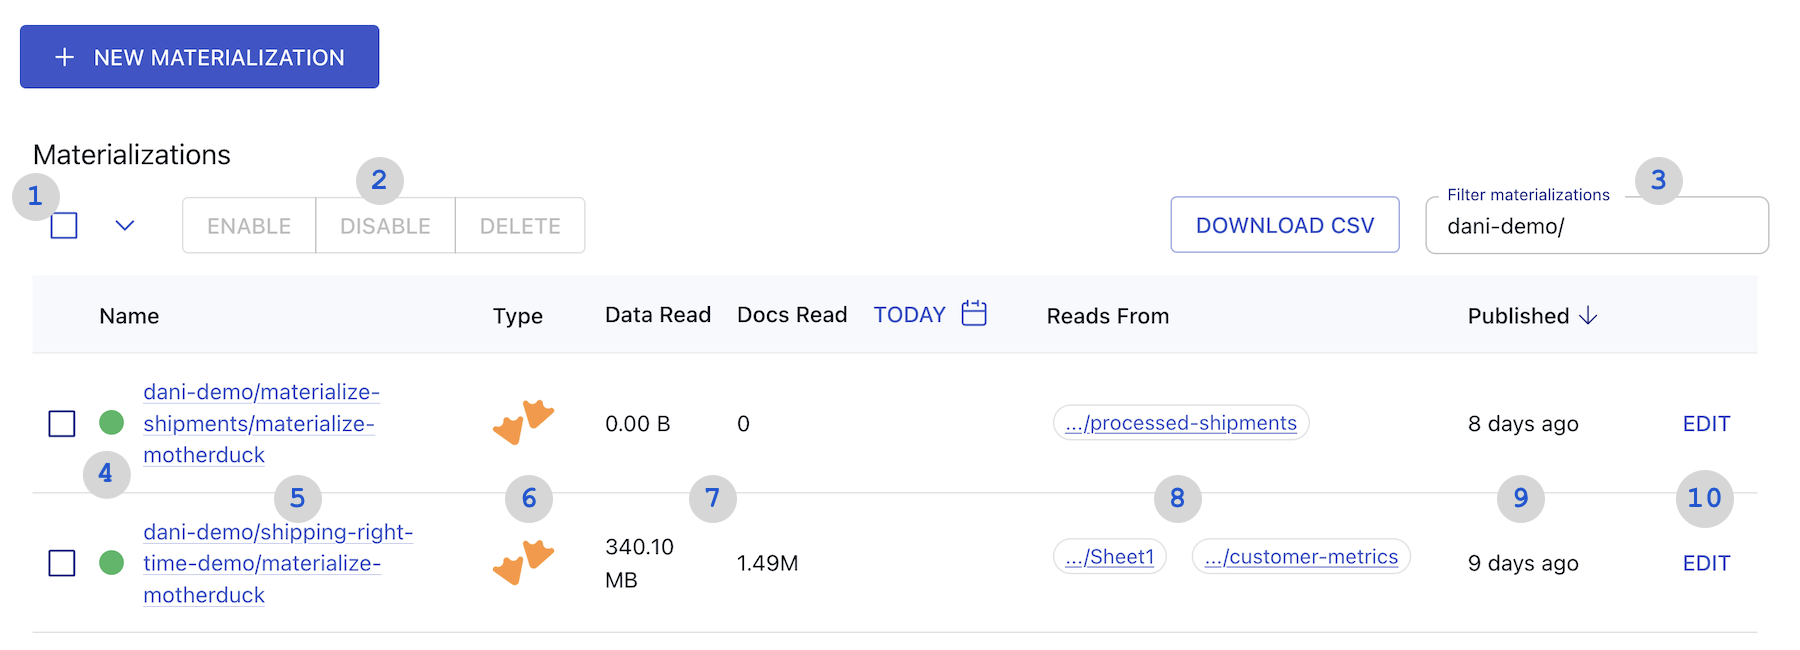
1: Select all or deselect all.
2: Enable, Disable, and Delete buttons. These actions will be applied to the selected table rows. Choose Disable to temporarily pause the flow of data, Enable to resume, and Delete to permanently remove the materialization(s).
3: Filter materializations. Type a catalog prefix, unique materialization name, or connector name to return materializations that match your query.
Materialization names follow the pattern prefix/unique-identifier/connector-name, with prefix supporting multiple layers of nesting.
You can search for any part of this full materialization name. You can also use the * wildcard.
For example, if you have a materialization called acmeCo/logistics/anvil-locations/materialize-snowflake,
you can find it by filtering for acmeCo*materialize-snowflake.
4: Status indicator. Shows the materialization's shard status.
- Primary (Green): Data is actively flowing through the materialization.
- Pending (Yellow): The materialization is attempting to re-connect. Often, you'll see this after you re-enable the materialization as Estuary backfills historical data.
- Failed (Red): The materialization has failed with an unrecoverable error.
- Disabled (Hollow circle): The materialization is disabled.
- Unknown (Black when app is in light mode; white when app is in dark mode): The web app is unable to determine shard status. Usually, this is due to a temporary connection error.
5: Materialization name. The full name is shown, including all prefixes. It also links to the materialization details page.
6: Materialization type. The icon shows the destination system data is materialized to.
7: Materialization statistics. The Data Written column shows the total amount of data, in bytes and in documents, that the materialization has read from its associated collections within a configurable time interval. Click the time interval in the header to select from Today, Yesterday, This Week, Last Week, This Month, Last Month, or All Time.
8: Associated collections. The Reads From column shows all the collections from which the materialization reads data. For materializations with a large number of collections, there is a chip stating how many collections are hidden. Clicking on this will allow you to hover over this column and scroll to view the full list. These also link to the details page of the collection.
9: Publish time. Hover over this value to see the exact time the materialization was last published.
10: Edit button. Click to edit the materialization.
Editing materializations
When you click Edit for a materialization, you're taken to the Edit Materialization page.
This page is similar to the Create Materialization page. It comes pre-filled with the materialization's's current configuration, with the exception of sensitive SOPS-encrypted credentials.
For detailed steps to edit a materialization, see the guide.
Creating a materialization
There are several ways to begin creating a materialization:
- Clicking New Materialization on the Materializations page.
- Selecting one or more captures from the Captures page and clicking Materialize.
- Selecting one or more collections from the Collections page and clicking Materialize.
- Clicking Materialize from a capture's details page.
- Clicking Materialize from a collection's details page.
When you initiate the workflow in any of these ways, all available materialization connectors are displayed. Select a connector to reveal the full form with configuration options specific to your desired destination.
Fill out the Endpoint Config form. In the Target Collections section use the Collection Selector to map collections to resources in the destination system.
Note that if you entered the workflow from a Capture or Collection page, collections will be pre-populated for you.
For detailed steps to create a materialization, see the guide.
Materialization Details Page
When you click on the name of a materialization on the materializations page you will be taken to the detail page to view data stats, sharding information, and general details.
Overview tab
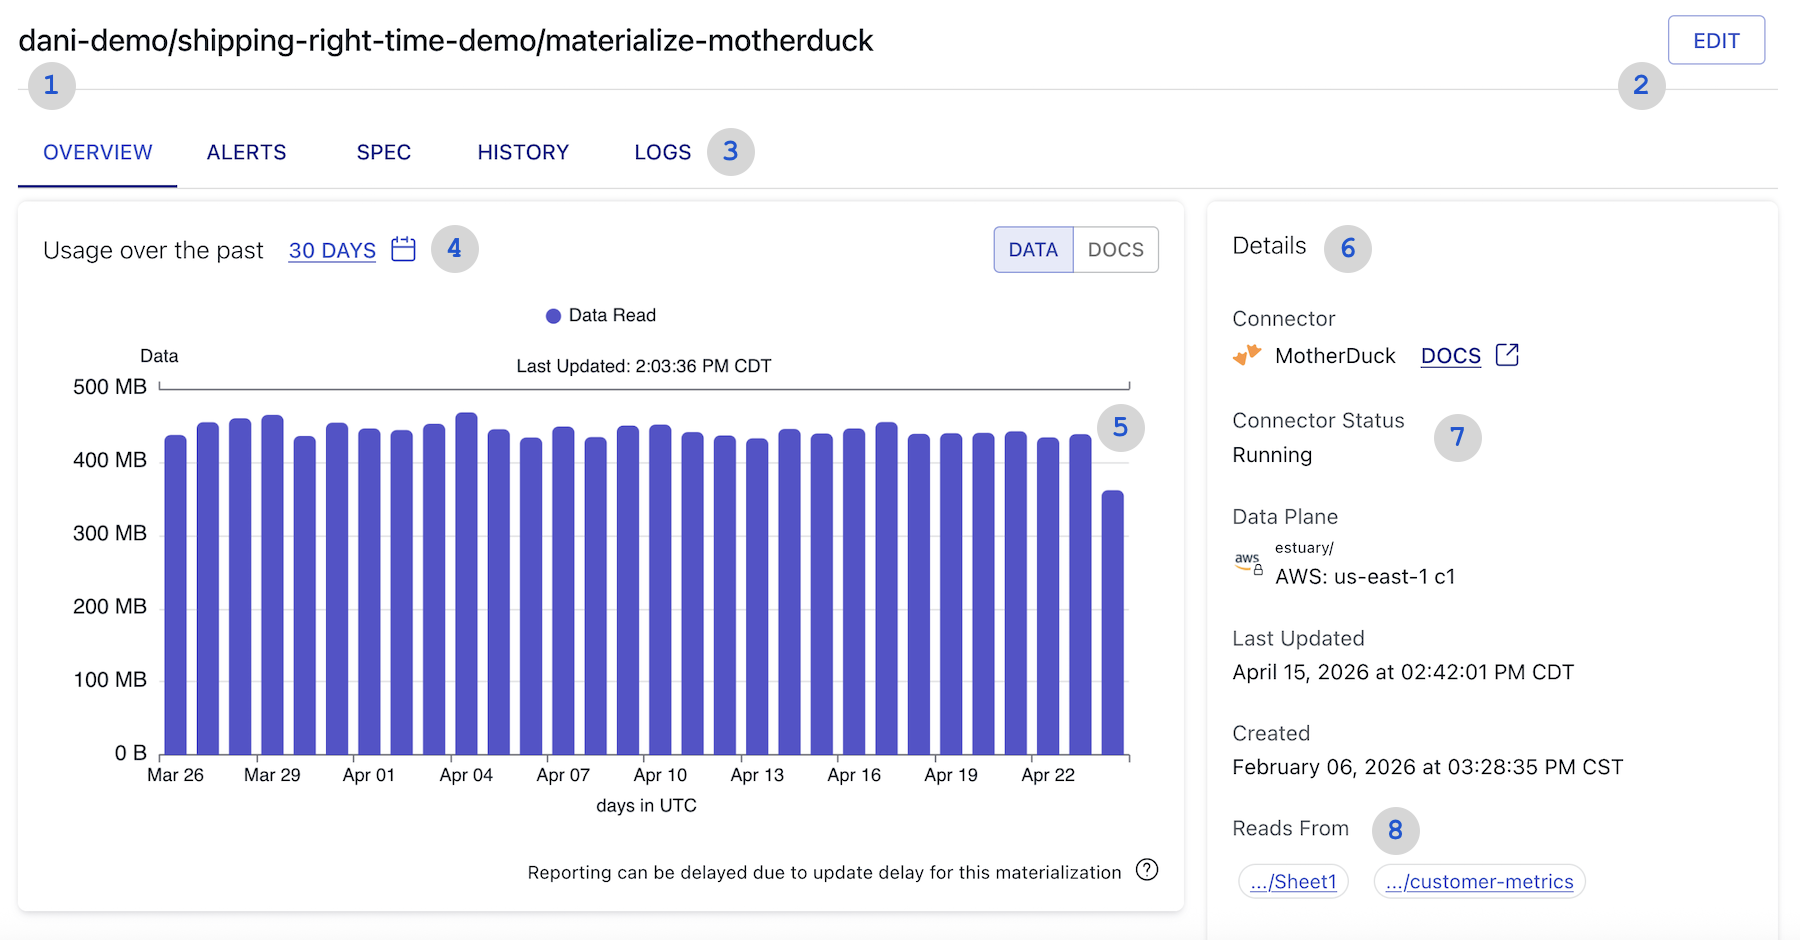
1: The full name of the materialization.
2: Edit button to modify your materialization.
3: Page tabs. Switch between the Overview, Alerts, Spec, History, and Logs tabs for detailed information in each category.
4: Usage chart filters. Click the time interval to select from 6 hours, 12 hours, 24 hours, 48 hours, 30 days, or Year. You can also choose to view usage in Data Read (in bytes) or Docs Read.
5: Usage chart with materialization statistics. This chart displays the data read by the materialization in the chosen timeframe. Hover over a section to see specific details for that timeframe. The most recent segment will automatically update every 15 seconds with the latest data and docs.
6: Details section. This contains information about the materialization, such as the connector type, the data plane being used, and create/update timestamps.
7: Connector status. The current status of the connector. This may indicate backfill progress or streaming status.
8: Associated collections. Shows all the collections from which the materialization reads data. These link to the collection's detail page.
The Overview tab also includes a Shard Information section. This displays the full identifier of the shard(s) that back your materialization. If there's an error, you'll see an alert identifying the failing shard(s).
Alerts tab
The materialization's Alerts tab breaks down into three main sections.
Notification Settings
This section allows you to configure a Data Movement alert for the materialization.
You can choose a time interval between 1 Hour and 7 Days. If data has not been processed within this timeframe, a notification will be sent to anyone subscribed to the alert.
If you are not subscribed, this section will display an info box with the option to Click Here to subscribe.
Active Alerts
The Active Alerts section displays any currently firing alerts. This includes details on the alert type, when the alert fired, any recipient emails, and error messages or additional details related to why the alert fired.
Resolved Alerts
The Resolved Alerts section displays historical alerts. The table provides information similar to the Active Alerts table with the addition of a resolution time for the alert.
Spec tab
In the Spec tab, you can view the specification of the materialization itself.
The spec includes the materialization's endpoint configuration, settings to configure target naming and recommended fields, and associated bindings.
History tab
The History tab provides a change history of the materialization's specification.
The list of changes includes:
- The date and time the change occurred
- Who initiated the change
- Any notes related to the change; for example, noting an automatic update, such as auto discovery or a dataflow reset
Selecting a change from the list will display a diff to the right that highlights changes made to the specification.
Logs tab
The Logs tab displays task logs for the materialization.
Logs include the log level, timestamp, and log message. Select a log to expand the log message.